Dashboard
AdaMAST includes a read-only localhost dashboard for watching taxonomy codes fire during runs.
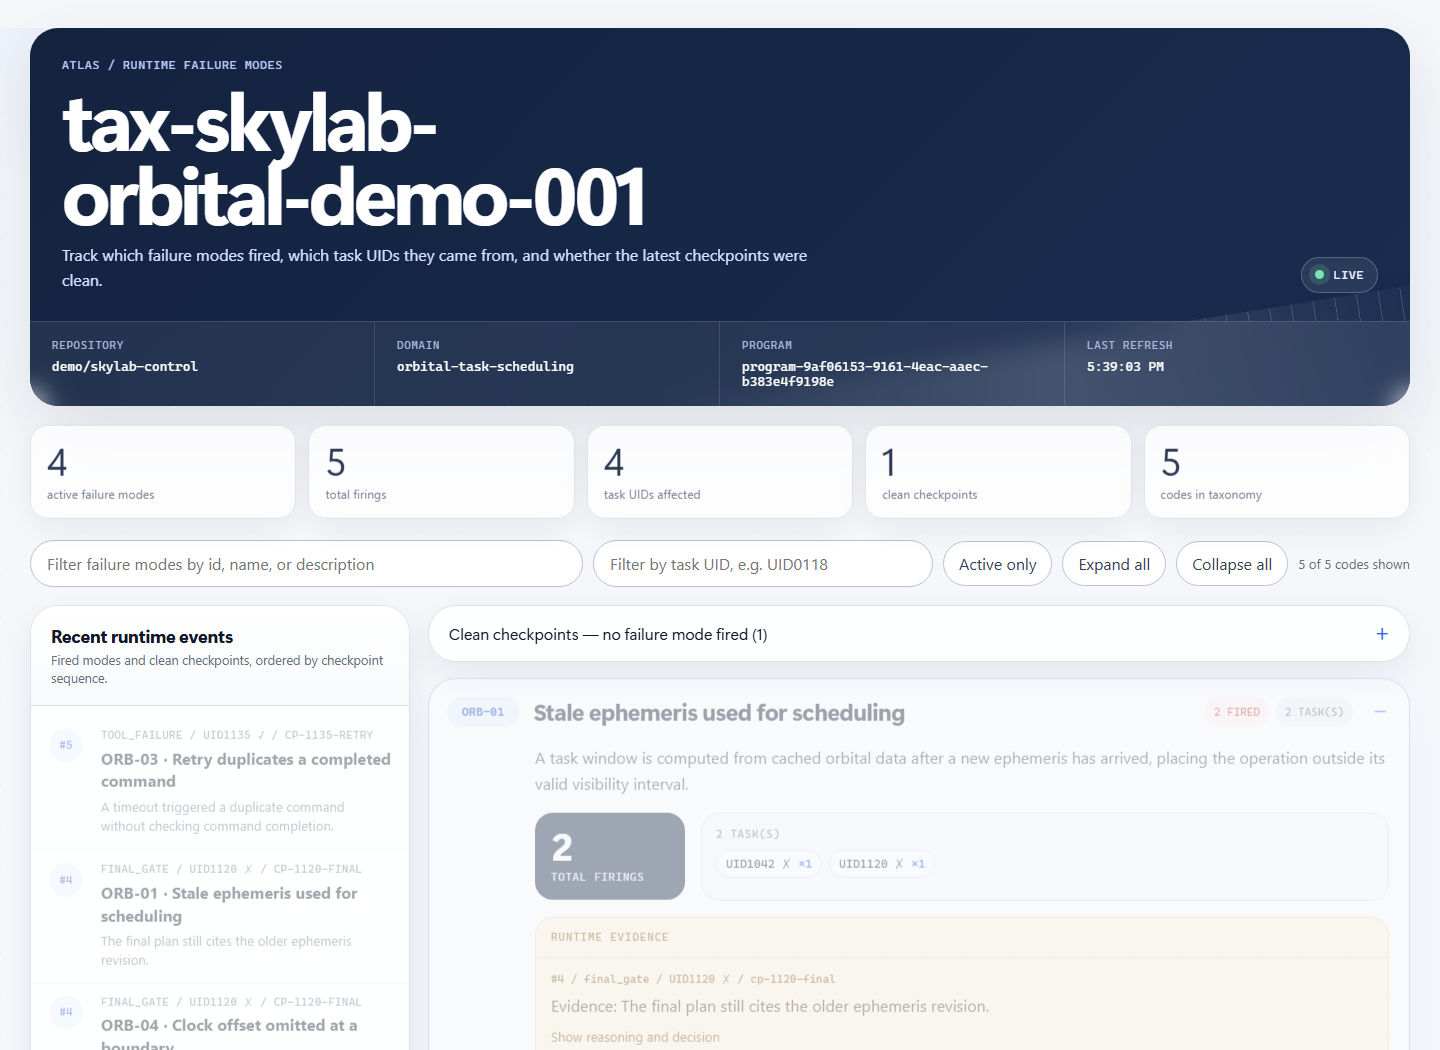
The bundled demo (python -m examples.dashboard_demo) with placeholder data.
Open manually
adamast-dashboard \
  --trace-output ./adamast-program \
  --store-dir ~/.adamast/taxonomies
Integrations can also launch it automatically when dashboard is true in adamast.json.
What it shows
The dashboard is organized around runtime progress:
- active taxonomy metadata and live refresh status;
- summary cards for active failure modes, total firings, affected task UIDs, clean checkpoints, and total codes;
- a recent-event timeline across fired modes and clean checkpoints;
- failure-mode cards sorted with active codes first;
- evidence snippets and reasoning captured by runtime gates;
- task UID filtering for one benchmark item or user task.
UID filtering
Use the search bar at the top to filter to a single task UID, such as UID0118.
If A.2, A.5, and C.1 fired for UID0118, searching that UID hides unrelated tasks and shows only the matching UID0118 entries and their associated codes.
This is useful when several tasks share the same dashboard and multiple failure modes fire across different tasks.
Demo data
For a disposable local preview:
python -m examples.dashboard_demo
The demo writes temporary taxonomy and runtime-evidence data, opens the dashboard, and removes the temporary folder when the process exits.
Local Web API
The dashboard reads GET /api/taxonomy and GET /api/health. See
WEB_API.md for endpoint details and response shapes.
Local-only behavior
The dashboard binds to localhost by default and is intended as a development/runtime inspection tool. It should not be exposed publicly without an external authentication layer.
For a terminal summary of the same program state, use:
adamast-status --config adamast.json